Washington State Department of Revenue (DOR) recently released data regarding the state’s taxable retail sales during the first quarter of 2018 (January to March).
Looking at all taxable retail sales including those involving services and construction:
| 1Q17 | 1Q18 | % of change | |
| Washington State | $34.1B | $37.6B | 10.3 |
| Whatcom County | $913.4M | $1.01B | 10.8 |
| Ferndale | $50.4M | $58.7M | 16.5 |
Looking only at consumer sales of items such as clothing, furniture and automobiles (referred to as “retail trade”):

Click for more information

Click for more information
| 1Q17 | 1Q18 | % of change | |
| Washington State | $14.5B | $15.8B | 8.6 |
| Whatcom County | $398.8M | $449.5M | 12.7 |
| Ferndale | $17.7M | $20.1M | 13.5 |
DOR pointed out the following state-wide highlights from the data:
- Construction rose 11.1 percent to $7.4 billion
- Taxable retail sales reported by new and used auto dealers increased 2.2 percent to $3.3 billion
- Drug and health store sales jumped 9.1 percent to $733 million
- Lawn and garden supplies and equipment rose by 13.7 percent to $186 million
The biggest increases in all taxable retail sales occurred in the counties of Kitsap (14.8%) and Skagit (14.9%). The biggest increases in large cities happened in Spokane Valley (11.5%) and Vancouver (13.9%).
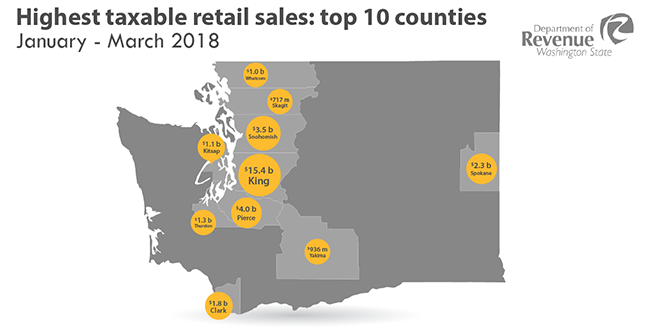
Whatcom County ranked 7th in the state for total taxable retail sales during the first quarter.
| County | Taxable retail sales | % of change | Retail trade | % of change |
| King | $15.4B | 9.0 | $5.3B | 6.5 |
| Pierce | $4.0B | 10.4 | $1.9B | 8.2 |
| Snohomish | $3.5B | 10.1 | $1.8B | 6.8 |
| Spokane | $2.3B | 10.1 | $1.1B | 9.0 |
| Clark | $1.8B | 13.9 | $747M | 10.2 |
| Thurston | $1.3B | 9.4 | $630M | 11.9 |
| Kitsap | $1.1B | 14.8 | $556M | 10.4 |
| Whatcom | $1.0B | 10.8 | $450M | 12.7 |
| Yakima | $936M | 14.1 | $453B | 10.5 |
| Skagit | $717M | 14.9 | $371M | 8.8 |
The Department of Revenue is Washington state’s primary tax agency.
Discover more from Whatcom News
Subscribe to get the latest posts sent to your email.