WHATCOM COUNTY, Wash. — Data collected by BC Ministry of Transportation & Infrastructure and Washington State Department of Transportation and compiled by Whatcom Council of Governments provide a perspective on current border crossing volumes.
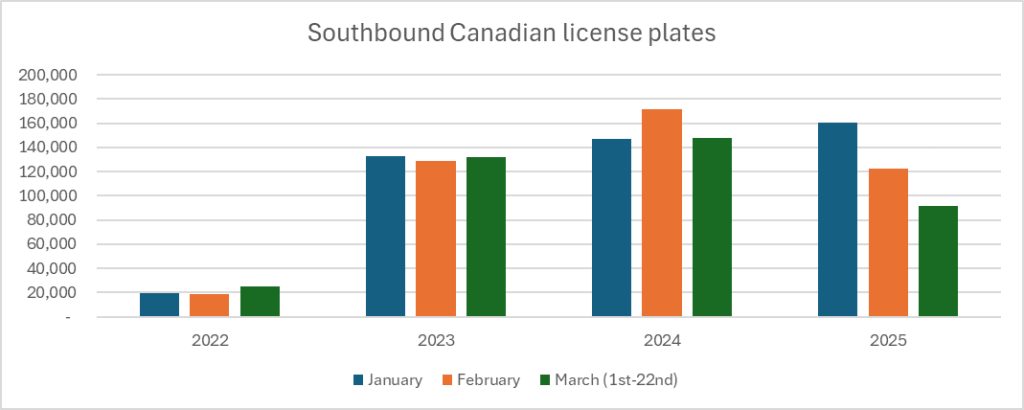
The first graph reflects southbound traffic across Whatcom County border crossings by vehicles with Canadian license plates.
The second graph reflects northbound traffic across Whatcom County border crossings by vehicles with US license plates.
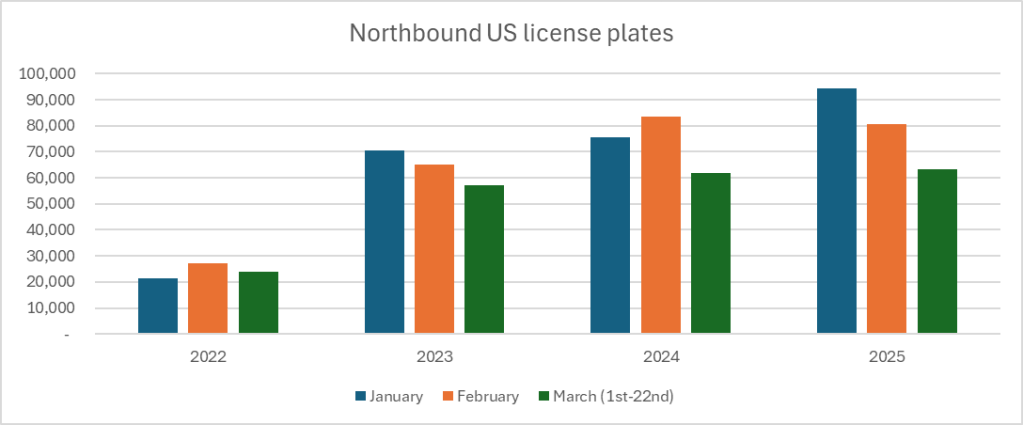
The data reveals decline in volumes over January, February and March this year for both directions. Although, northbound US vehicle volumes remain above or at 2024 volumes.
The same cannot be said for southbound Canadian vehicle volumes which, with the exception of January, are at or lower than 2023 levels. Compared to 2024, 2025 February traffic was off by 25% which includes travel challenges due to extreme winter weather during the first 2 weeks and March traffic (from the 1st to the 22nd) is off by 38%.
Discover more from Whatcom News
Subscribe to get the latest posts sent to your email.
A bit of sugar coating in the headline and the article. To say that US border crossings are “above” is a bit misleading—is that about 1% we see on the bar chart for US-Canada for March? And if the Canada-US was affected by bad weather was that not true for the other direction. We need to face reality-Canada-US will continue to drop like a rock devastating Blaine business—and it was all so unnecessary.